- Home
- Resources
- Five in Five
Five in Five
Welcome to Five in Five, a monthly publication from the Investment Team at BTC Capital Management. Each month we share graphs around five topics that illustrate the current state of the markets, with brief commentary that can be absorbed in five minutes or less. We hope you find this high-level commentary to be beneficial and complementary to Weekly Insight and Investment Insight.
July 2026
This month’s Five in Five covers the following topics:
- June Payrolls
- Equity Benchmark Performance as of 6/30/2026
- Index Performance Attribution – Factor Performance
- Fixed Income – Stuck in the Mud
- Bond Yields Remain Above Long-term Inflation
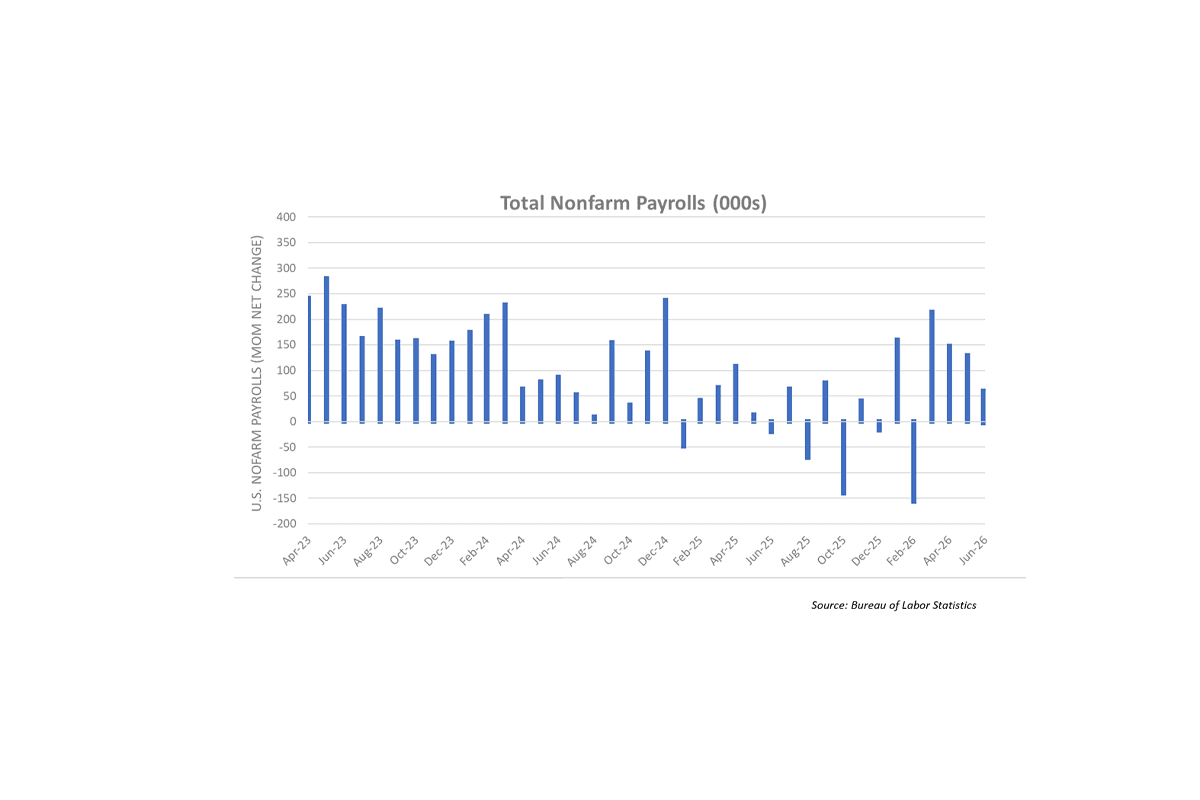
June Payrolls
- June payroll numbers rose 57K in June, seasonally adjusted versus a 129K prior.
- These figures were softer than expected and prior months’ figures were revised downward.
- The household survey showed the unemployment rate declined to 4.2% from 4.3%.
- The decline of the unemployment rate primarily reflected people leaving the labor force than finding work.
- Despite the weaker job figures they are still strong enough for the Fed to consider raising rates in 2026.
Source: Bureau of Labor Statistics
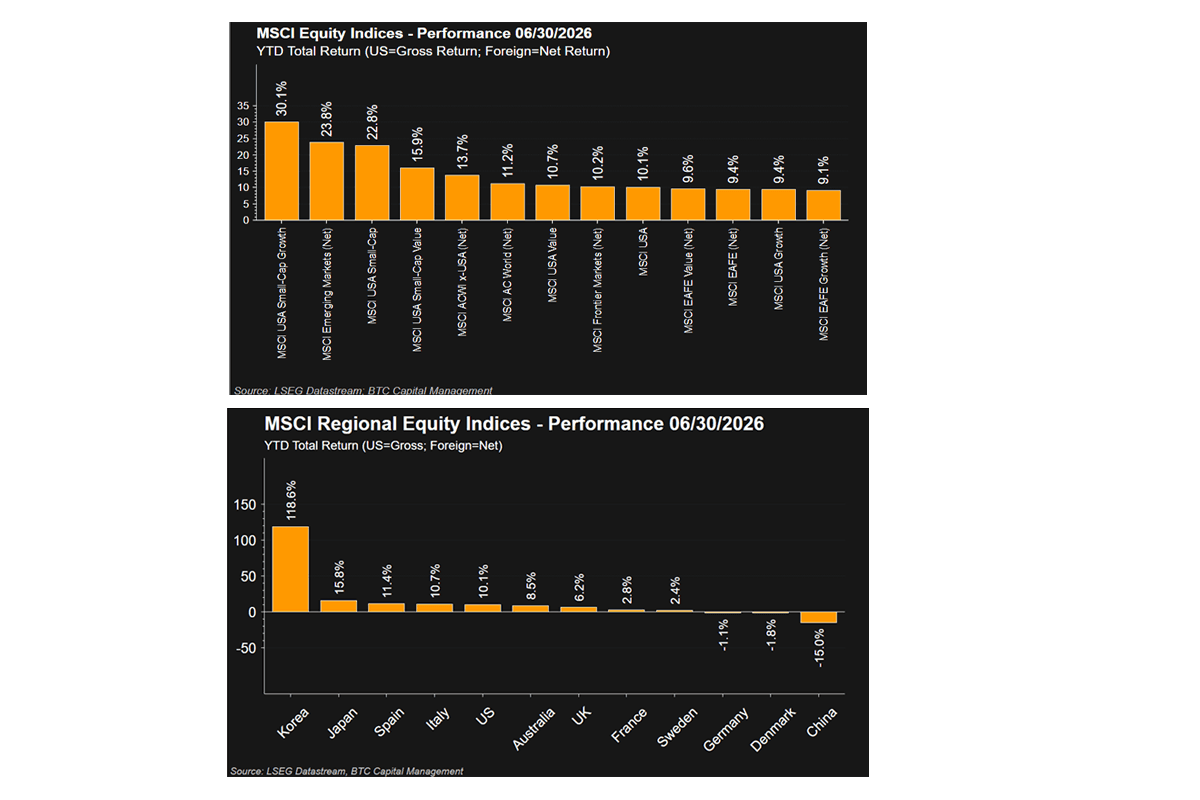
Equity Benchmark Performance as of 6/30/2026
MSCI indices (left-chart) YTD:
- USA Small Cap measures surged during second quarter 2026, occupying three of the top four year-to-date (YTD) performance series.
- USA Small Cap Growth +30.1% now outpaces Emerging Markets +23.8%.
- USA Small Cap +22.8 %
- USA Small Cap Value: +15.9%
- Emerging Markets +23.8 % continues to be driven by Korea +118.6%.
- ACWI x-USA +13.7% skewed higher by emerging markets.
Regional equity indices (right-chart) YTD:
- Korea continues its leadership, +118.6% YTD.
- Japan, the largest regional constituent of EAFE, returned +15.8% YTD versus +9.4% YTD for EAFE.
- China, given its -15.0% YTD drawdown, is now the 3rd largest constituent region within the EM index, having been the top constituent region as of 12/31/2025.
Sources: LSEG Datastream; BTC Capital Management
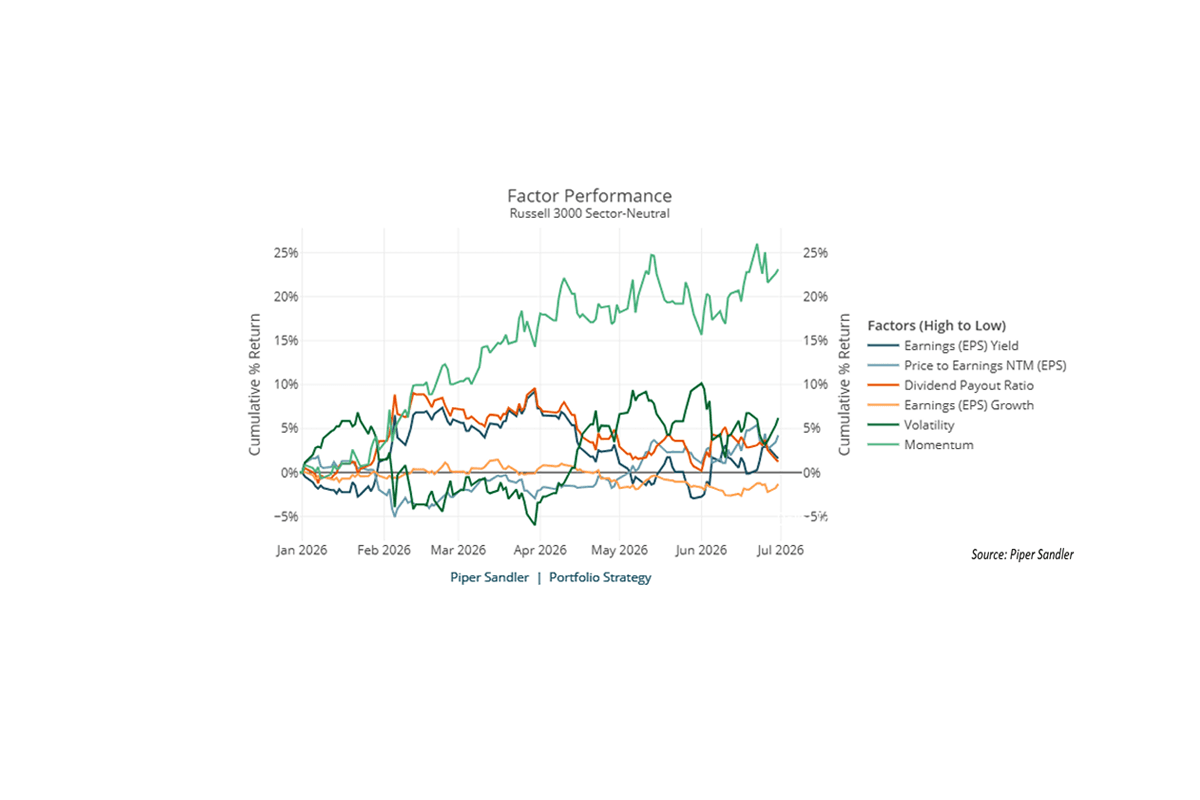
Index Performance Attribution – Factor Performance
Factors are one facet of equity-index performance attribution, explaining both risk and return over the measured period. The chart above exhibits the YTD factor returns for the Russell 3000 Index.
- Momentum +23.1% YTD, continued its leadership from 2025.
- Volatility, the 30-day variance in daily price change, +6.2% YTD.
- Price to Earnings NTM (EPS), defined as Current Share Price / NTM EPS, advanced +4.2%YTD.
- Earnings (EPS) Yield, measuring LTM EPS / Current Share Price, rose +1.6% YTD.
- Dividend Payout Ratio, defined as LTM Dividends Per Share / LTM EPS, returned 1.2%.
- Earnings (EPS) Growth, which measures the 5-Year Median of the year-over-year (YOY) change in LTM Net Income, was the only factor exhibiting a negative return having declined 1.3% YTD.
Source: Piper Sandler
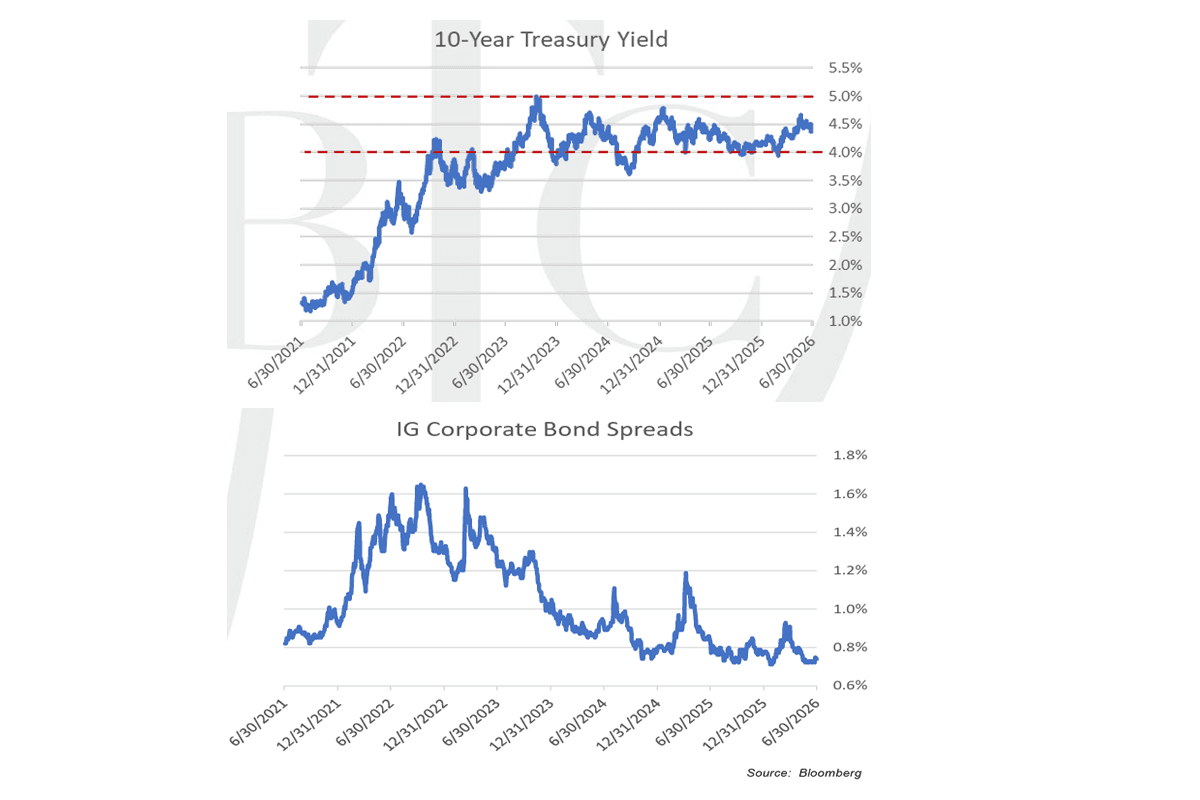
Fixed Income - Stuck in the Mud
- The 10-year Treasury yield remains within well defined multi-year range.
- Corporate bond spreads are near all-time lows.
- Citi Economic Index current high reading => easier for yields to move lower in the near-term.
- Waiting on a catalyst that materially changes predominant consensus outlooks.
- Return expectations appear more centered around starting yield levels.
Source: Bloomberg
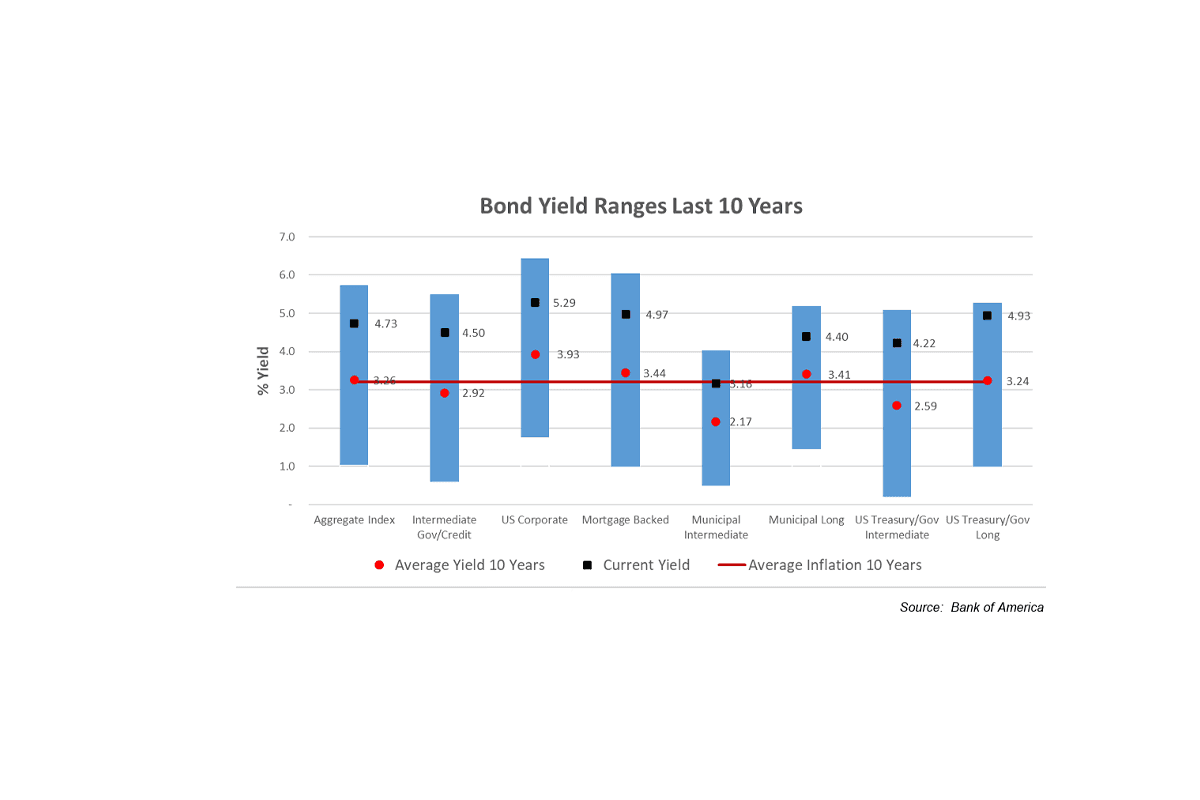
Bond Yields Remain Above Long-term Inflation
- A bond market’s yield is an indicator of the return an investor will earn for years to come.
- Yields earned today on bond portfolios remain at the upper level of the 10-year range.
- Investors into a Core/Aggregate Bond strategy could expect to earn 4.73% today from that investment.
- This compares to the average inflation rate over the last 10 years of 3.2%. So, today bonds can be a stable source of real income (returns above inflation).
- With mid-year reached, it’s a good time to look at rebalancing portfolio risk.
Source: Bank of America
Important Disclosures
Sources: BTC Capital Management, Bureau of Labor Statistics, LSEG, Piper Sandler, Bloomberg, Bank of America
The information provided has been obtained from sources deemed reliable, but BTC Capital Management and its affiliates cannot guarantee accuracy. Past performance is not a guarantee of future returns. Performance over periods exceeding 12 months has been annualized.
This document is intended for informational purposes only and is not an offer or solicitation with respect to the purchase or sale of any security. Statements in this report are based on the views of BTC Capital Management and on information available at the time this report was prepared. Rates are subject to change based on market and/or other conditions without notice. This commentary contains no investment recommendations, and you should not interpret any statement in this report as investment, tax, legal, and/or financial planning advice. All investments involve risk, including the possible loss of principal. Investments are not FDIC insured and may lose value.